Learn chart pattern – double top – and use it to zoom to Johor Bahru for your holidays!
Share
Share
Email
Telegram
WhatsApp
An entertaining piece for you, but it works!! Cool Guy
Trades from The Alien Wash Indicators
Signup for insights into what we are trading and many possible explosive trades. We won't spam you. Only useful information and materials.
Thank you!
Look out for our email to confirm your email address. Check our junk, spam or promotion tab if you didn't receive it.
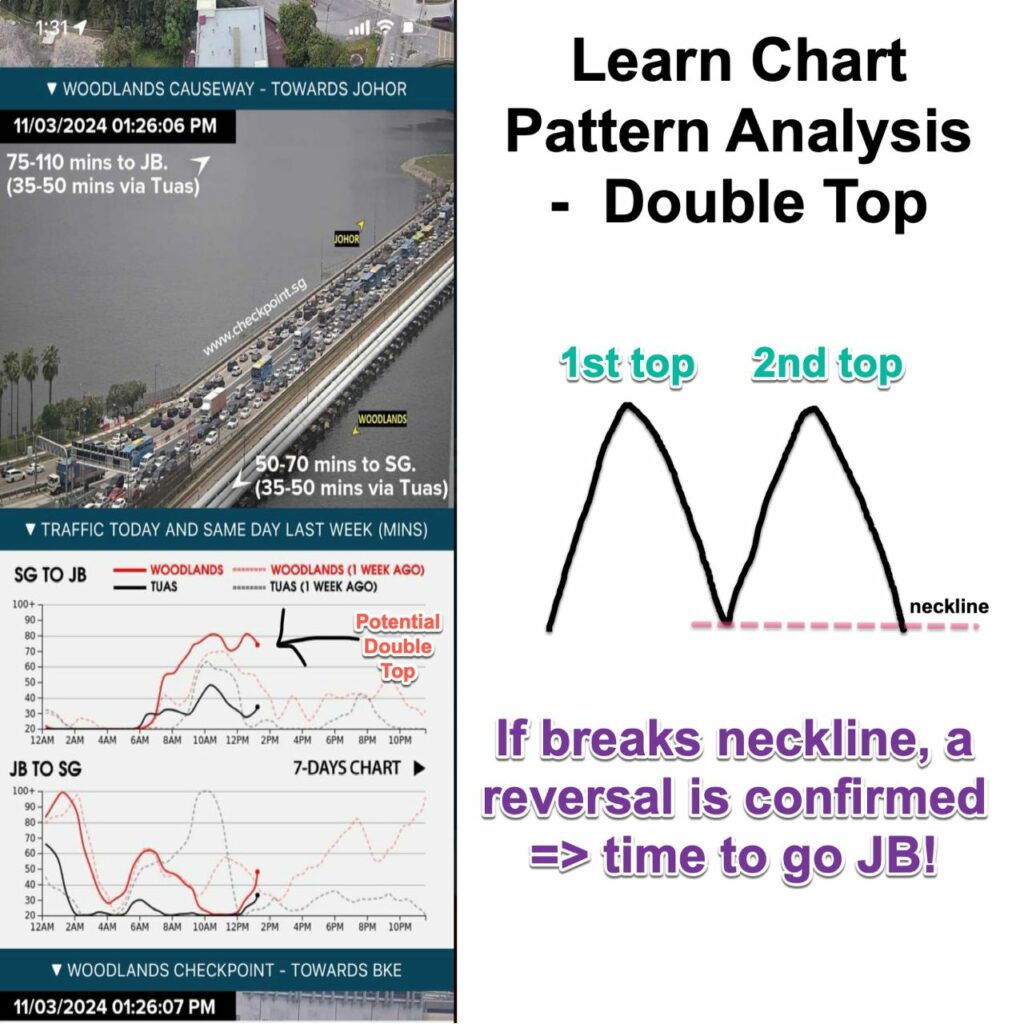
A double-top chart pattern is a bearish signal in technical analysis. Let me break it down for you:
What Is It?
Imagine the price of an asset (like a stock or cryptocurrency) reaching a high point twice in a row.
Between these two highs, there’s a moderate decline.
This pattern looks like the letter “M” on a price chart.
How to Spot It:
Look for two almost equal-sized peaks (the tops) that are close in height.
These peaks are separated by a trough (a low point).
The price tries to break past the resistance level (the top) but fails both times.
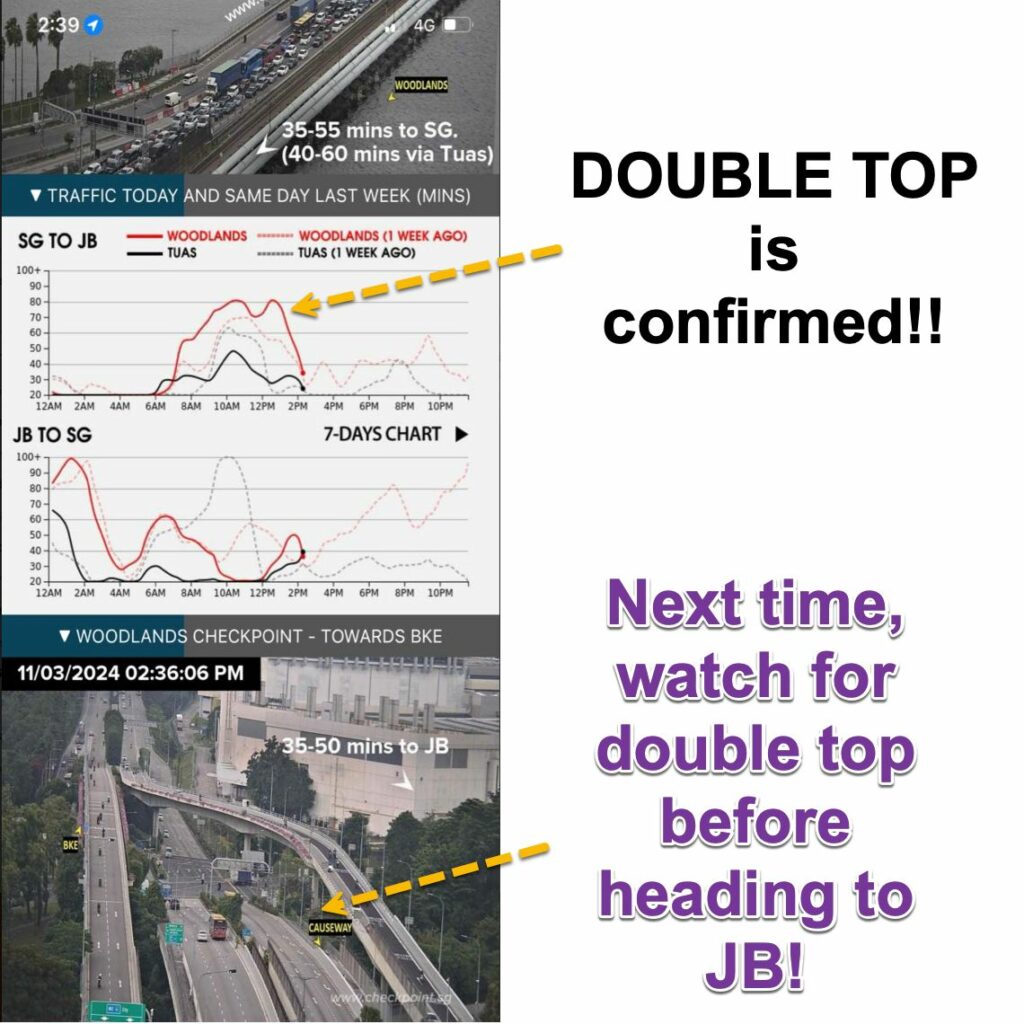
What It Means:
A double top suggests that the asset’s upward trend is losing steam.
It’s like the market saying, “We can’t push the price higher anymore!”
Traders often see this as a signal to sell or enter short positions (betting that the price will go down).
Get a FULL CASH refund* on The Alien Wash Course