Bullish Divergence explained with live case study from Keppel DC Reit
Share
Share
Email
Telegram
WhatsApp
Imagine a car is moving at 240 km/h and needs to make a U-turn 200 m ahead. How do you know if the car can successfully make the U-turn? It might be able to do so if the car can slow down.
Trades from The Alien Wash Indicators
Signup for insights into what we are trading and many possible explosive trades. We won't spam you. Only useful information and materials.
Thank you!
Look out for our email to confirm your email address. Check our junk, spam or promotion tab if you didn't receive it.
The reversal in stock price movement works the same as the above analogy. Price momentum will have to slow down first. The slowing down is a clueto a possible successful turning process.
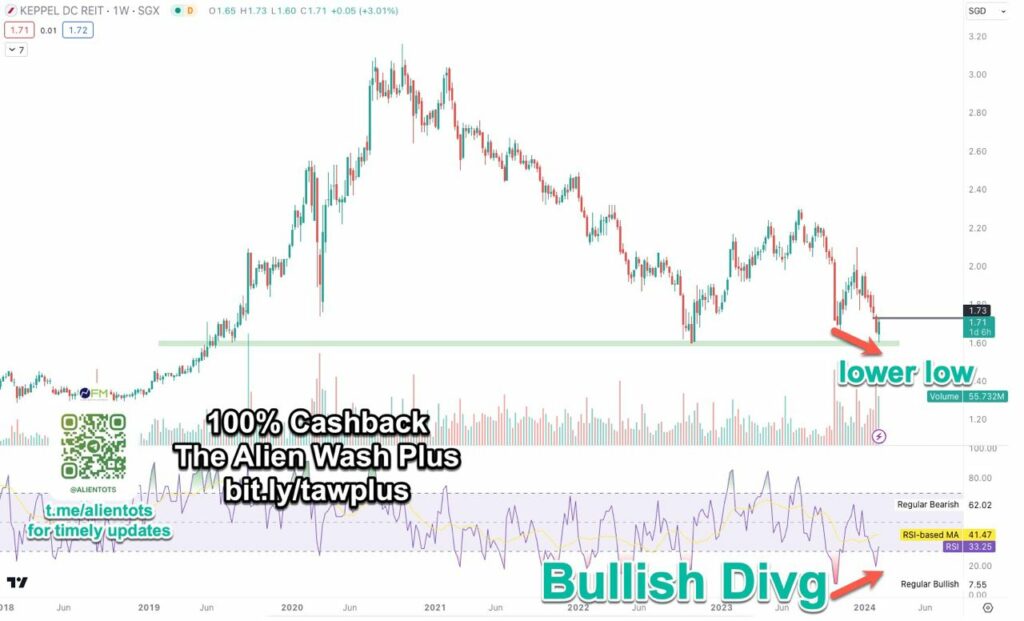
This is what divergence in stock trading is about. Today, I am going to explain bullish divergence using a live example on $Keppel DC Reit (AJBU.SG)$.”
Bullish Divergence: In technical analysis, bullish divergence occurs when the price of an asset forms a new low, but an oscillator or technical indicator fails to confirm the new low and instead forms a higher low. This suggests that the downtrend may be losing momentum and could potentially reverse, indicating a possible buying opportunity.
Sign of Potential Reversal: Bullish divergence is a signal of a potential trend reversal, indicating that the bears are losing strength and the bulls may take control of the market. It is important to look for confirmation from price action before relying solely on bullish divergence to make trading decisions.
Live Example: Today, I am going to explain bullish divergence using a live example on $Keppel DC Reit (AJBU.SG)$ to illustrate how this concept works in stock trading.
Price Action: KDC makes a lower-low
Indicator: MACD-histogram makes a higher low
Price confirmation: To confirm this is a valid reversal, the price will need to trade above 1.75 on a close
Get a FULL CASH refund* on The Alien Wash Course